Background
Like all useful APIs, the Google Static Maps API has a lot more complexity than you might think for something that "just" generates a map of the world at a given location.
Basic usage of the API
Check out the intro guide on Google's documentation site for an overview of the specs.
Here's the URL for a 650x400 pixel map centered around "Vietnam":
http://maps.googleapis.com/maps/api/staticmap?size=650x400¢er=Vietnam
That URL actually points to an image file, which we can embed on any webpage with this HTML code (i.e. a standard <img> tag:
<img src="http://maps.googleapis.com/maps/api/staticmap?size=650x400¢er=Vietnam">
And here it is, embedded in this page:
The "region" parameter
OK, seems simple enough. But the documentation lists many more ways to customize the rendered image, including changing the zoom level, the satellite imagery, adding custom markers, and specifying the language of the labels.
But one curiously named parameter, region, has this description:
region (optional) defines the appropriate borders to display, based on geo-political sensitivities. Accepts a region code specified as a two-character ccTLD ('top-level domain') value.
What does "geo-political sensitivities" mean? Let's take the example URL above and see what it looks like when the region is the United States – as we really don't know what Google has chosen by default (or whether it changes depending on which country you're viewing this webpage from). The United States has a top-level domain code of us, which you can find from this list.
Here's the URL; in the printout here, I've omitted the first part of the URL since it is always the same:
/staticmap?size=650x400¢er=Vietnam®ion=us
Maybe that's the same as the one above? Kind of hard to eyeball it exactly, if we have to scroll up and down to compare them. If only there was a way to alleviate that inconvenience…Oh well, let's just assume it's the same and see what the map of the Vietnam region looks like from Vietnam's political perspective:
/staticmap?size=650x400¢er=Vietnam®ion=vn
Looks about the same. How about Japan?
/staticmap?size=650x400¢er=Vietnam®ion=jp
Looks like everyone is in agreeance so far…Let's check China just to make sure…
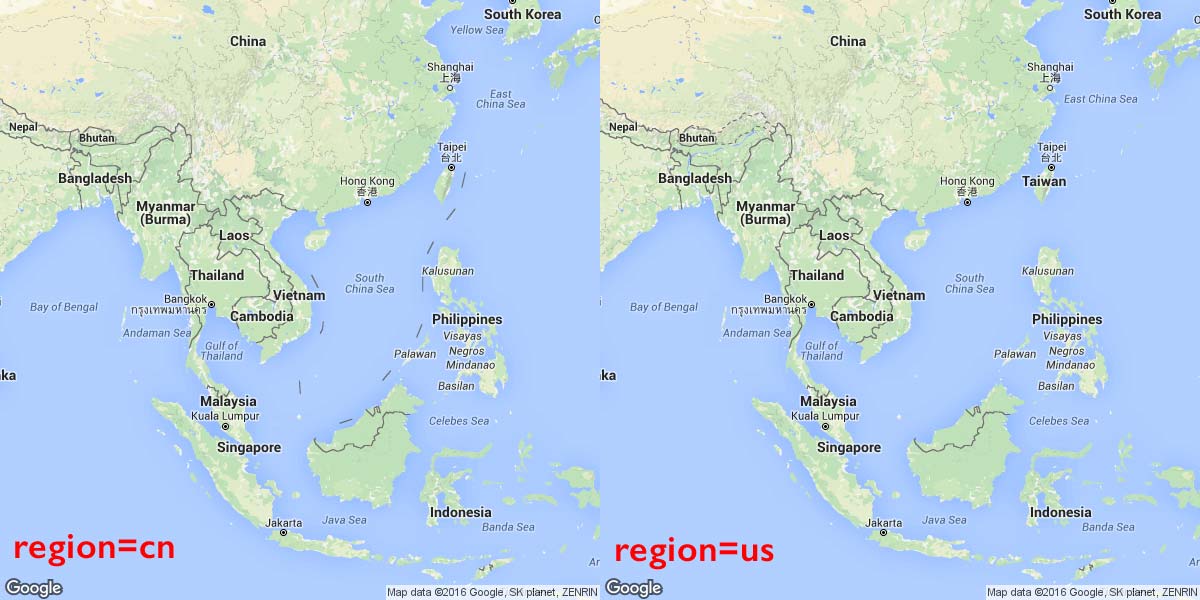
/staticmap?size=650x400¢er=Vietnam®ion=cn
A quick glance seems to reveal a few minor differences: a text label seems to be missing, a few dash marks are added in the water…but the land masses look the same…?
Different countries, different borders
As it turns out, China has particular laws and regulations about geographic data, so Google has to "partner with a Chinese digital map provider in order to legally show China map data". Among one of the most visible differences:
Within China, the State Council mandates that all maps of China use the GCJ-02 coordinate system, which is offset from the WGS-84 system used in most of the world.
Of course, China isn't the only country with geopolitical opinions. Let's see how to use a little programming to get a fuller view of the world's border disputes.
Simple visualization
In the section above, I noted how annoying it was to have to scroll the webpage, up and down, to detect differences between the maps. One obvious way to fix this is to put the images physically nearer to each other. Don't underestimate the power of such an easy-to-explain-and-implement solution.
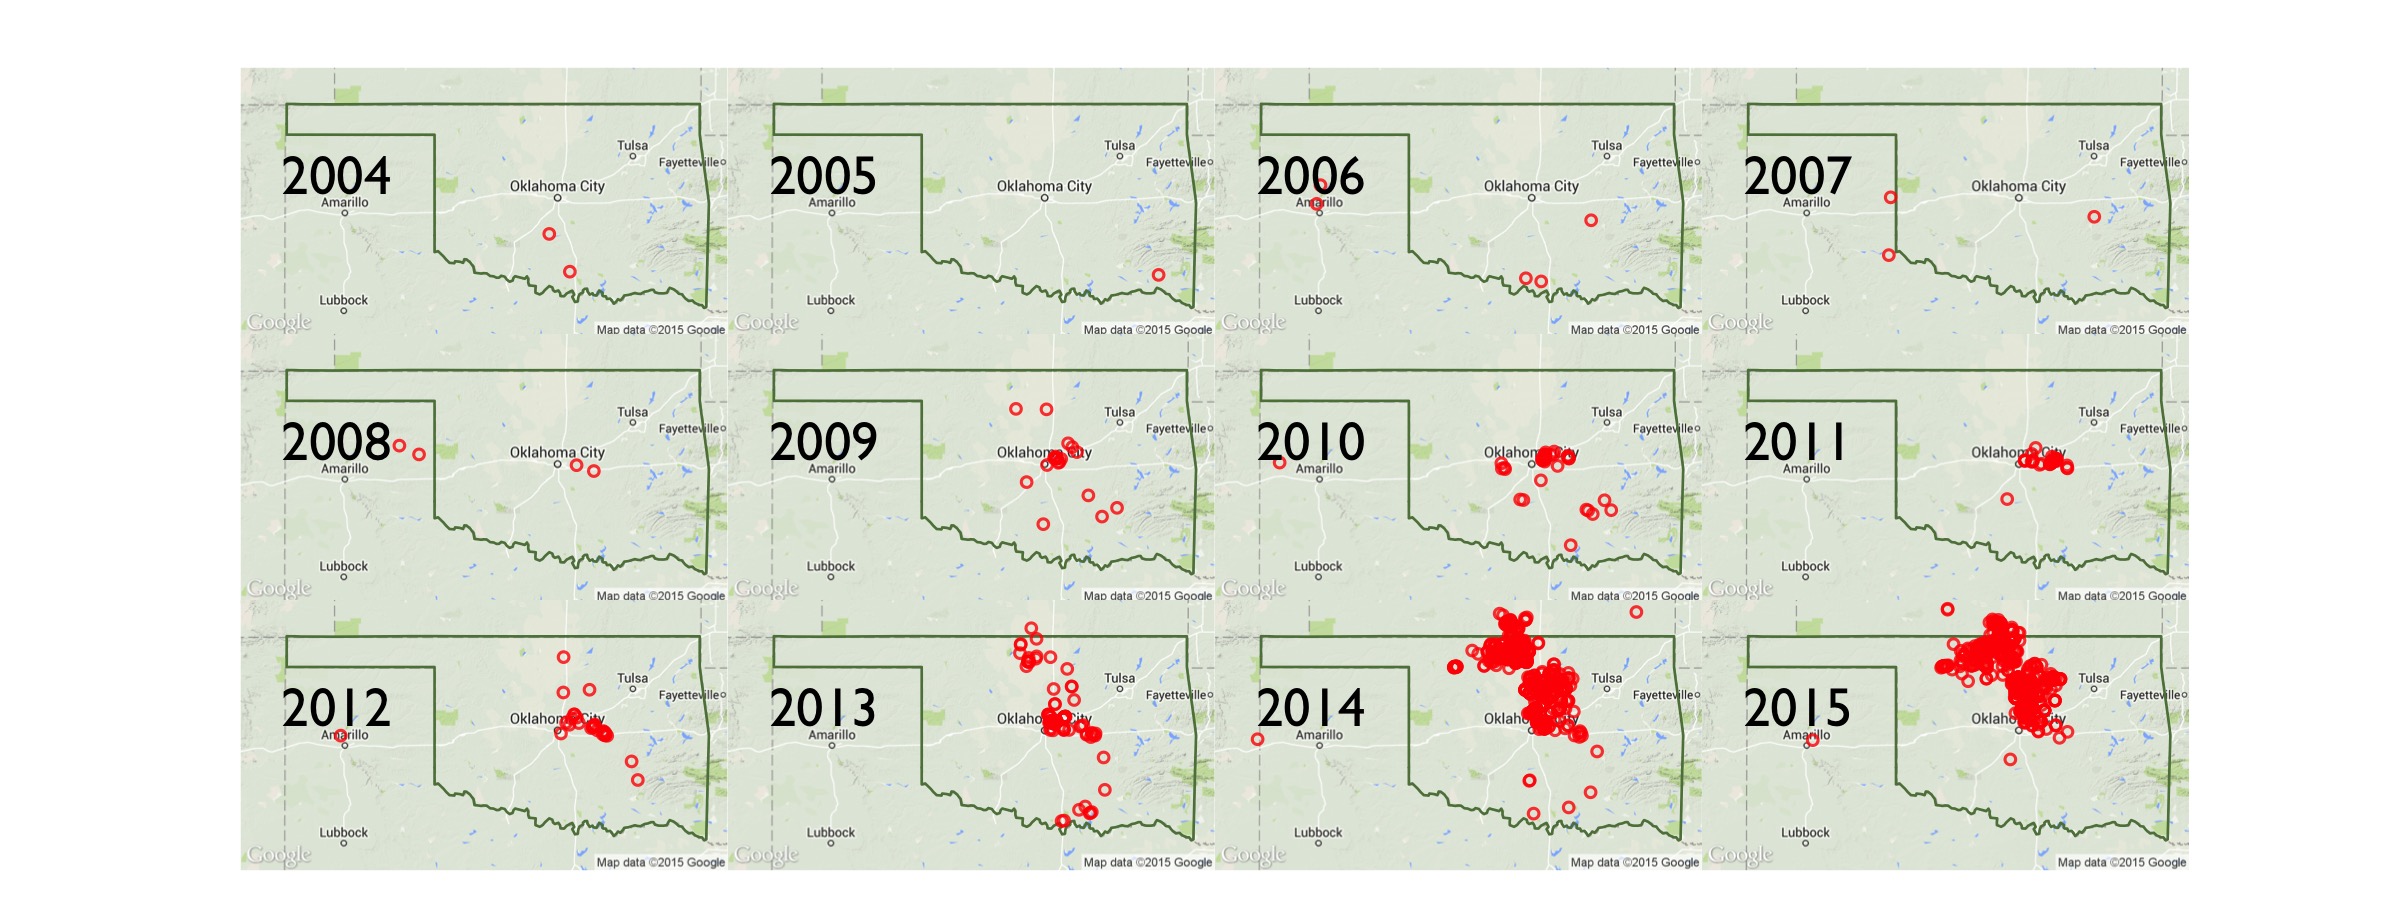
The simple act of making two facts physically (i.e. visually) easier to compare, is the very purpose and function of data visualization. It doesn't have to be bar charts; here's a visualization I made that's simply the combination of 12 Google Static Maps, aligned in 4 rows by 3 columns, with red dots drawn where M3.0+ earthquakes have taken place, according to USGS data:
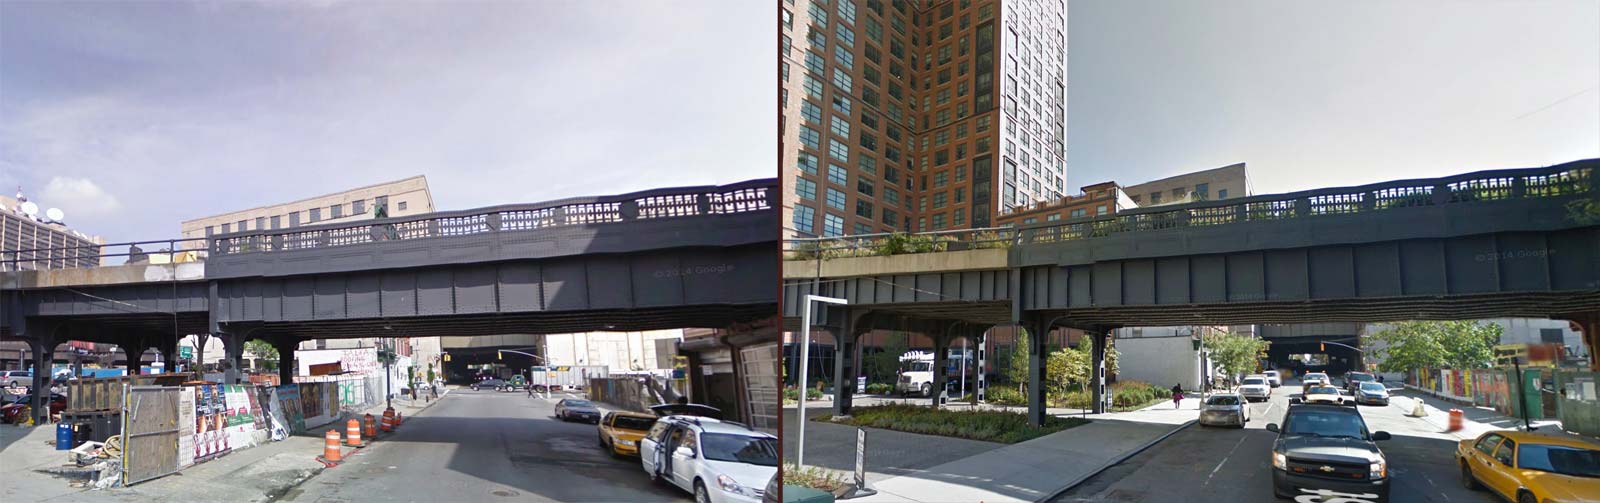
But even just two images, side by side, can be compelling. Think of the effectiveness of all those before-and-after ads about weight-loss and aging:
West 29th Street, New York, 2009 vs 2014, via Google Street View
The Photoshop approach
How to put two images side-by-side? Nothing wrong with going the old-fashioned way: copying and pasting both images into Photoshop, adding appropriate labels, and saving as a new file, then uploading the file online. Here's an example:
Of course, what's wrong with that is that it's incredibly tedious. If you decide you want to change the zoom level, or other visual characteristic, or change up the label, expect to go through what is at least a 5 minute hand-editing job.
Good ol' HTML tables
Sometimes images needed to be combined via image software. But one of the huge advantages of building for the web is that we can just write text that describes what images we want, and where to put them.
Here's some code that puts two image elements, side by side, in a HTML table row. There's even some caption text. Even if you don't know HTML, you can recognize the pattern:
<table>
<tr>
<td>
<img src="http://maps.googleapis.com/maps/api/staticmap?size=650x400¢er=Vietnam®ion=cn">
<p>China</p>
</td>
<td>
<img src="http://maps.googleapis.com/maps/api/staticmap?size=650x400¢er=Vietnam®ion=us">
<p>United States</p>
</td>
</tr>
</table>
|
China |
United States |
While the Static Maps API is pretty simple for trying out a few parameters at a time, it's a bit tedious to hand-fix those parameters, over and over.
This is where a little programming can help.
The algorithm
We want to write a little script that iterates through combinations of border disputes (i.e. geographic locations) and the countries (i.e. their country-codes) who differ in their opinions on the borders.
For each location, we produce one Google Static Maps URL for each country.
For example, if the location is Taiwan, the base URL looks like this:
http://maps.googleapis.com/maps/api/staticmap?&size=400x400&zoom=5¢er=Taiwan
If we want to compare China's worldview versus Taiwan's, we supply the region parameter with cn and tw, respectively, which means we want 2 separate URLs:
http://maps.googleapis.com/maps/api/staticmap?&size=400x400&zoom=5¢er=Taiwan®ion=cn
http://maps.googleapis.com/maps/api/staticmap?&size=400x400&zoom=5¢er=Taiwan®ion=tw
Data gathering
We don't need to go to a spreadsheet for this, this is something you might be able to think off the top of your head. What are the obvious hot spots in the world? And which countries have different – and strong opinions about them?
- Make a list of locations around the world that have disputed territories and boundaries.
- Make a list of countries and their corresponding top-level domain 2-letter codes.
Map image files
We only need one API: The Google Static Maps API
The specifications of which are:
- Endpoint: https://maps.googleapis.com/maps/api/staticmap
- Parameters:
- size (required): width by height, in pixels, e.g.
400x400 - center: where the center of the map should be at. It does not have to be latitude/longitude; we can specify a human-readable name, such as,
India - maptype: e.g.
hybrid,satellite,roadmap,terrain - zoom: e.g.
1for worldwide,15for street-level resolution, up to20 - region: the 2-letter top-level-domain of the country for which we want to see the geo-political sensitivities.
- size (required): width by height, in pixels, e.g.
Here's an example: To get a 500x500 pixel roadmap (the default design), that is zoomed in at slightly closer than a continent level, focused on Stanford, California, according to the geopolitical opinions of Kyrgyzstan:
| key | value |
|---|---|
| size | 500x500 |
| center | Stanford, CA |
| maptype | roadmap |
| zoom | 6 |
| region | kg |
To download that file via Requests and save it to our computer:
import requests
ENDPOINT_URL = 'https://maps.googleapis.com/maps/api/staticmap'
my_params = {
'size': '500x500',
'center': 'Stanford, CA',
'maptype': 'roadmap',
'zoom': 7,
'region': 'kg'
}
resp = requests.get(ENDPOINT_URL, params=my_params)
# to get the URL, call `resp`'s `url` attribute:
print(resp.url)
# https://maps.googleapis.com/maps/api/staticmap?zoom=7®ion=kg¢er=Stanford%2C+CA&size=500x500&maptype=roadmap
# And if you want to save a copy on your computer:
f = open("stanford-kg.png", "wb")
f.write(resp.content)
f.close()
Of course, you don't have to save it on your computer if you don't want to. Part of the deal with Google's API is that it generates a URL that you can directly visit:
So why even save the file in the first place? We don't have to if we don't want to. But we do want to take advantage of the way the Requests library serializes (i.e. turns a Python dictionary into a proper URL query string) the key-values for us.
Using requests.PreparedRequest to generate a URL
There's a way to use that feature without actually executing a request (via requests.get()) – it's to use the PreparedRequest type, which is part of the requests library…and easier to just see in action than to explain all the details:
import requests
ENDPOINT_URL = 'https://maps.googleapis.com/maps/api/staticmap'
my_params = {
  'size': '500x500',
  'center': 'Stanford, CA',
  'maptype': 'roadmap',
  'zoom': 7,
  'region': 'kg'
}

pr = requests.PreparedRequest()
pr.prepare_url(ENDPOINT_URL, params=my_params)
print(pr.url)
Basically, when we do an actual requests.get() method call, the Requests library contains code that does all of the setup, including the construction the actual URL string to be called. Most of the time we don't care about that intermediary step, so the get() method just goes right ahead and downloads from that URL.
But in this case, we don't need to download the URL. We just want to get the URL. Because that's all we need to fill out HTML tags for our simple webpages.
More to come…